|
|
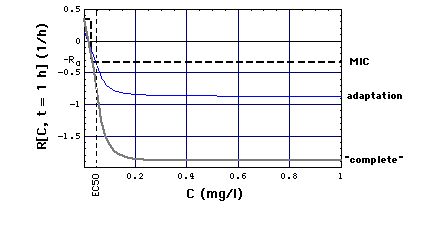
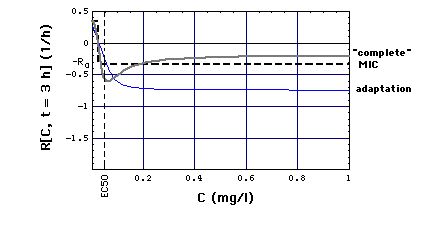
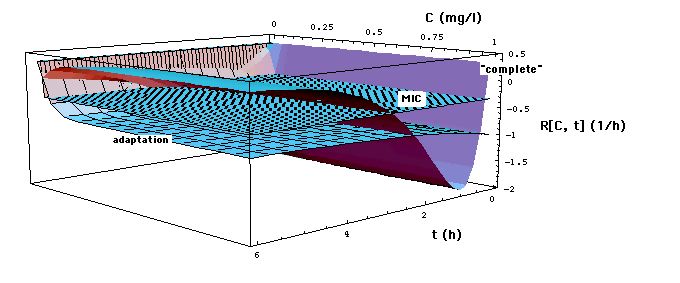
Fig. 2a: Staphylococcus aureus strain 1 reproduction or kill rate R[C, t] as a function of time t and meropenem concentration C, calculatd with "complete", "adaptation" and MIC models. Parameters used, i.e. eqs. (16, 16m), are the ones that give best experimental fits. Lower part of figure shows cross sections through upper part at t = 1 and t = 3 h. MIC[t = 1 h] = 0.029 mg/l, MIC[t = 3 h] = 0.024 mg/l has been determined in Fig. 6 .
Note that at C >> EC50 the Emax model curves lie below the (dashed) MIC model curve, in particular
R[C = 0] = R0 = 0.33 /h.
To fit the experiments one needs to assign such counterintuitive Emax model rates R (Mattie et al., Mouton et al. 1997, Vinks et al, 2004].