Home
--> Hintergrund:
Inadequacy of the "Minimum Inhibitory Concentration" --> THE
INADEQUACY OF MIC: ILLUSTRATIONS
The Inadequacy of the Minimum Inhibitory Concentration
by Joachim Gruber
HERMAN MATTIE,
LI-CHEN ZHANG, ELISABETH VAN STRIJEN, BEATE RAZAB SEKH,
AND ANNA E. A. DOUWES-IDEMA
Department of Infectious Diseases,
University Hospital Leiden, 2300 RC Leiden, The Netherlands
ANTIMICROBIAL AGENTS AND CHEMOTHERAPY,
Oct. 1997, p. 2083?2088 Vol.
41, No. 10
Abstract
Problem
When a bacteria population can be
exposed to an antibiotic in-vitro in the same way as it is in vivo, the
in-vitro experiments quantify the efficacy of the antibiotic.
When the antibiotic has strong side
effects, one has to optimize between those effects and the risk of losing
control over the bacteria population. In such critical cases an in-vitro
model with only one parameter, the Minimum Inhibitory Concentration, may
not be able to describe the development of an in-vitro bacteria population
accurately enough. The Emax model presented here provides more accurate
predictions, thus helping with the optimization. It can do so only at the
expense of needing more information about the effect of the antibiotic,
i.e. more model parameters. The pharmaceutic industry is willing to provide
that information. It seems that the ball is now in the field of the treating
physician: S/He needs to voice interest in those data.
Methods
The development of the number N[C,
t] of the bacteria over time t under the influence of an antibiotic at
concentration C is described by a non-linear first order differential equation.
Four approximations of the growth or decay rate R[C, t] are used.
-
In the traditional MIC model, the rate
R is constant in time and independent of C, except at two threshold concentrations
C = MIC (Minimum Inhibitory Concentration) and C = MBC (Minimum Bactericidal
Concentration, MBC > MIC). When C increases across these thresholds, the
rate jumps:
-
when -starting from C = 0- C passes
through MIC, the rate jumps from a positive value, R, to 0, and
-
when C passes through MBC the rate jumps
from 0 to - R.
-
In three so-called Emax models the rate
R may depend on the antibiotic concentration C and the time t over which
the bacteria have been exposed to the antibiotic.
-
In the "adaptation" model, the rate
R is a smoothed version of the MIC model jump at C = MIC, and thus also
independent of t, i.e. R[C]. The time dependency in R describes the process
of adaptation of the bacteria population to the antibiotic with a simple
exponential law.
-
In the two other Emax models the time
dependency of R[C, t] is represented by an asymmetrical bell-shaped curve
with a rate maximum ERat time tmax.
-
In the complete version of this model,
both the rate maximum ER and its time tmax depend
on C: The functions ER[C] and tmax[C] are so-called
"Hill expressions", which are basically smoothed step functions.
-
In a simple version, tmax
does not change with C. Only the rate maximum ER is concentration
dependent as given by a "Hill expression" ER[C].
Results
-
When the antibiotic (meropenem) dose
is chosen so that the bacteria population neither grows nor decays, i.e.
when the meropenem concentration C is by definition near MIC, the MIC model gives a number of surviving bacteria typically deviating from the experimental values by less than plus or minus one order of magnitude.
-
At concentrations C >> MIC, the MIC model gives too large bacteria populations (typically by two or more orders of magnitudes), thus being a conservative model.
-
Independent from the meropenem concentration C the (compared to the MIC model more sophisticated) Emax model predicts bacteria population sizes that deviate from the data by typically a factor of three.
The results have been calculated with
a program written in Mathematica (version 3.0). The program
is a useful tool for conveying a feeling for the quantitiative influence
of the system parameters. The program and my examples can be read with
the free MathReader:
The Mathematica Notebook Reader.
Introduction:
Pharmacokinetics, Pharmacodynamics and
the Influence of the Immune System
-
Pharmacokinetics calculates the distribution
of the pharmaceutical within the body, i.e. in a system of interconnected
compartments.
-
Pharmacodynamics calculates the development
over time of the bacteria population under the effect of a pharmaceutical.
(A) The pharmacokinetic model is potentially
misleading to the unexperienced pharmacologist when
-
the data and paramters describing a
certain compartment have not been determined (as is often the case for
intracellular locations) and
-
the fraction of the bacteria population
in that compartment is non-negligible.
(B) Two similar statements apply to
pharmacodynamic models. The model might not help in directing the therapy
and control the illness when
-
the dynamics of a bacteria population
in a certain compartment under the influence of the pharmaceutical is unknown,
-
the reaction of the immune system to
the combined action of the pharmaceutical and the bacteria cannot be quantified.
Therefore, the pharmaceutical has to
be -and often is- chosen such that neither (A) nor (B) is relevant, meaning
that -given over a fixed period valid for all of us- the drug kills off
or inhibits the growth a relevant fraction of the bacteria population,
and the immune system does the rest to restore our health.
For short, I will call this "the
one size fits all concept", meaning that all of us will be cured by the
same therapy. When this therapy fails and we are sure that our diagnosis
was correct, we talk of "niches"
into which the bacteria can withdraw and be out of reach of the drug and
immune system. Niches have been demonstrated
-
in technical systems, e.g. in water
supply systems where one possible niche is a biofilm, as well as
-
in living systems, e.g. in our sinus-maxillary
floor.
Such "niches" are the subject of research
and therefore not usually known to our treating physicians. We -as patients-
need to call his attention to the forefront of research - ideally by finding
the relevant medical literature with the help of e.g. Medline.
Treatment failure manifests itself
in a continuing shift of body parameters from normal to borderline or "positive"
for a more or less wide range of illnesses. In many cases we do not know
the mechanism that produces the shift, but -from experience- we know how
to interpret it. Our interpretation might be called a "global understanding".
Of such global character is a large
part of our practical knowledge of the immune response that we apply in
therapies. Here is an example in the context of a case of neuroborreliosis
[Gruber, 2002]:
-
Whereas
the antibiotic itself brings about only exponential changes of the number
of bacteria,
-
the immune
system is shown to effect temporal oscillations of the number of the bacteria,
some of which are "self-organized".
A conservative antibiotic treatment
regime
-
must consider self-organized immune
system oscillations a sign for an ongoing active infection [Burrascano
2003, Gruber 2003]. and
-
can have its end only after the cessation
of these oscillations.
A more sophisticated treatment would
be accompanied by mathematical model calculations. When sufficiently quantitative
microscopic models of the immune response are missing, one might conceptually
attempt to describe the development with time t of the number N of bacteria
with the following global non-linear differential equation
 (1)
(1)
where the non-linearity as incorporated
in Rt summarizes the combined action of
-
the antibiotic and
-
the immune system
Such models
have been presented in the literature and are being used to optimize the
therapy. But they exceed the scope of this paper. So, the pharamcodynamics
discussed here will ignore the influence of the immune system.
I. The MIC Concept
By definition, a population of N bacteria
exposed in vitro to a concentration C of an antibiotic stops growing when
C is equal or higher than the Minimum Inhibitory Concentration (MIC).
When C drops below the MIC, the population grows with a rate R0,
where R0 is now the fraction of the population that enters the
cell division phase per unit time.
I. 1 Non-Linear Differential Equation
 (2)
(2)
I. 2 Growth- and Kill-Rates R0
As soon as the antibiotic concentration
exceeds the Minimum Bactericidal Concentration (MBC), the bacteria population
decays.
In the case of a cell wall
antibiotic, the straighforward model would assume that -when exposed to
an antibiotic concentration C > MBC- any bacterium dies that tries to cell
divide. Thus, the fraction of bacteria population that dies per unit time
is equal to the fraction of that population that would cell divide in the
absence of the cell wall antibiotic:
R[C > MIC] = - R[C
< MIC] = - R0 (3)
With the definitions
R[C <
MIC] = growth rate
- R[C > MIC]
= kill rate,
eq. (3) can be written as
kill rate = growth rate
With this simplification, the equation
describing the population dynamics in the presence or absence of an antibiotic
can be written as
 (4)
(4)
where
 (5)
(5)
I. 3 Bacteria Population Dynamics N[C,
t]
The bacteria population dynamics N[C,
t] can be calculated from eq. (4) as
 ("MIC model")(6)
It is shown in Figs. 1
and 1a.
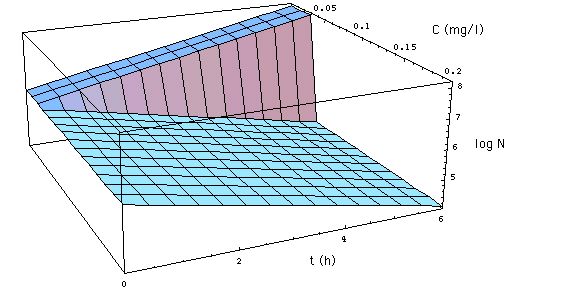
Fig. 1: Development of a
bacteria population as described by the MIC concept. x-axis is the time
axis (t measured in hours) y-axis gives the concentration C of meropenem
in mg/l. The z-axis gives the logarithm of the number N[C, t] of S. aureus.
N[C, t] as specified in (6), with R0
= 0.33 /h, MIC =
0.029 mg/l. The figure shows the development
of the population when MBC = MIC. (Click on Figure to see the development
for MBC = 3 MIC. )
The population
-
either grows with a growth rate R0
when the antibiotic concentration C < MIC,
-
decays with the (kill) rate -R0
when C > MIC = MBC.
The publication of
Mattie
et al. quantifies the drawback of the MIC concept and proposes an improved
pharmacodynamic model, which belongs to the class of so-called "Emax models".
II. The Emax Model: Mathematical Formulation
The improved mathematical model presented
by Mattie
et al. is based on 3 assumptions:
-
The bacteria population dynamics is
given by a non-linear differential equation.
-
The bacteria population reproduces -or
dies- with a rate R[C, t], for which an empirical
form is chosen. R[C, t] depends on 2 parameters ER[C] and tmax[C].
-
For the parameters ER[C]
and tmax[C] empirical Hill expressions
are chosen.
II. 1 Non-Linear
Differential Equation
The number of bacteria in the presence
of the antibiotic is calculated with a non-linear first order differential
equation similar to the one used for the MIC model:
 (7)
(7)
II. 2 Growth- and Kill-Rates
R
For the rate R[C, t] the authors chose
an empirical expression:
 (8)
(8)
where e is the base of the natural
logarithm (e = 2.718). This empirical expression is visualized in Fig.
2.
A yet simpler approximation would
replace the time dependence of R expressed in equation (8)
with an adaptation term associated with the growth rate R0
[Mouton et al. 1997, Koop et al.
2000, Zhi et al. 1986].
 (8m)
(8m)
where 1/a
is
the time constant for the bacteria population adaptation to the antibiotic.
Note the slightly different definitions
of ER[C] in eqs. (8) and (8m): ER[C]
in eq. (8) has a factor e = 2.718 in front of it, whereas
in eq. (8m) it does not.
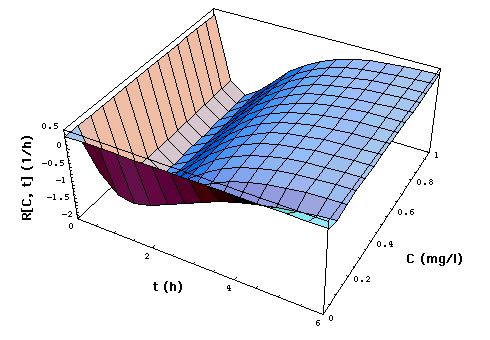
Fig. 2: Staphylococcus aureus
strain 1 rate R[C, t] as a function of time t and meropenem concentration
C, calculated with "complete model" and the pharmacodynamic
data eq. (16).
Clickon
upper part of figure to see R[C, t] calculated with "complete",
"adaptation" and MIC model.
Click here
to see a "lake" with surface R[C, t] = 0 filled into the eq.(8) R[C,
t] surface. The shoreline of this lake is the contour line R[C, t]
= 0, and thus -by definition- the funtion MIC[t].
The lower part of the figure shows
cross sections through the "complete" model surface in the upper part:
-
left side: cross sections at constant
C (C = 0, 0.05, 0.1, 0.15, 0.2, 0.25, ..., 1 mg/l) and
-
right side: cross sections at constant
t (t = 0, 1, 2, 3, 4, 5, 6h).
In the absence of meropenem (C = 0),
S. aureus strain 1 growth rate is R0 = 0.33 /h. The minimum
of R[C, t] as a function of t lies at tmax[C].
II. 3 Bacteria Population Dynamics N[C,
t]
The differential equation (7)
is then solved by separation of the variables
 (9)
(9)
and subsequent integration of both
sides of the equation (9):
 (10)
(10)
 ("complete model") (11)
A simpler versioin of eq. (11) would
neglect the concentration dependence of tmax[C],
replacing tmax[C]
with the constant T.
 ("simplified model") (12)
When the adaptation concept eq. (8m)
is plugged into eq. (9) the integration yields
 ("adaptation model") (13)
(4) Hill
Expressions for ER[C] and tmax[C]
Hill expressions are being used to quantify
the dependencies of ER and tmax on the antibiotic
concentration C:
 (14) (click on equation to see graphical representation of ER[C]
for meropenem)
(14) (click on equation to see graphical representation of ER[C]
for meropenem)
 (15) (click on equation to see graphical representation of tmax[C]
for meropenem)
(15) (click on equation to see graphical representation of tmax[C]
for meropenem)
III. Results
III. 1 Pharmacodynamic Data for Meropenem
Emax Model
The following parameters are the ones
that produced the best fits of the Emax models to the experimental data
(Fig. 5)
"complete" model"
EC50 = 0.047 mg/l;
(16)
S = 2.28 h-1;
T = 0.79 h;
s1 = 2.48;
s2 = 1.6.
|
"adaptation model"
EC50 = 0.047
mg/l; (16m)
S = 1.0 h-1;
a = 0.5
h-1;
s1 = 2.48;
|
III. 2 Population Dynamics in the Presence
of Meropenem
Fig. 3 is a plot
of the Emax population dynamics models ("complete" and "simplified") of
S. aureus as a function of time t and meropenem concentration C.
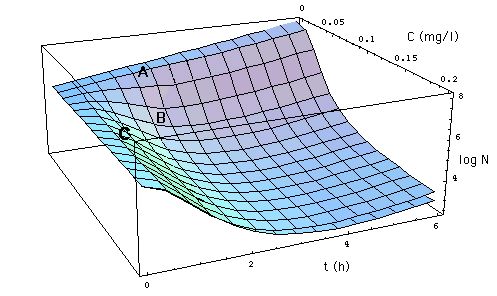
Fig. 3: Development of number
N[C, t] of S. aureus as a function of time t (x-axis) and meropenem
concentration C (y-axis). As in Fig. 1, the z-axis
gives the logarithm of the number N[C, t] of S. aureus. N[C, t] is specified
-
in the "complete" model (11,
lower surface) with empirical so-called Hill expressions (14)
and (15) for ER[C] and tmax[C],
respectively, and
-
in the "simplified" model (12,
lower surface), where an empirical Hill expression is used only for ER[C],
whereas tmax[C] = T (a constant).
III. 3 "Concentration-" and
"Time-Dependent" Antibiotics
The Emax models Fig. 3,
eqs. (11,
12) show that the effect
of an antibiotic can be dose- or time-dependent, depending on the concentration
of the antibiotic.
-
At low antibiotic concentrations (e.g.
C = 0.05 mg/l, point A in Fig. 3),
-
the effect of the antiibiotic is called
"concenrtation-dependent", meaning that
-
increasing the antibiotic C while keeping
the exposure time t constant (e.g. t = 2 h) will reduce the number N more
effectively than increasing the exposure time. Hence, here
-
Example: moving from initial position
A {t = 2 h, C = 0.05 mg/l} to final position B {t = 2 h, C = 0.1 mg/l}
reduces the population of S. aureus by approximately a factor of 20. A
similar reduction of N cannot be achieved by inreasing the exposure time
t.
-
At high antibiotic concentrations (e.g.
at C = 0.15 mg/l, point C in Fiig. 3) the situation is reversed
and the effect is called "time dependent":
-
increasing concentration C effects only
little change, whereas
-
increasing t is much more effective.
Often, an antibiotic is characterized
as having a concentration- or a time-dependent effect, when its usually
applied dosage places it in the concentration-dependent region A or in
the time-dependent region C, respectively [e.g. Goodman
and Gilman's, Craig 1998]. This habit is misleading,
since it is not the antibiotic that has that property but rather the dosage.
III. 4 Comparison of Population Dynamics
Models
Fig. 4 compares the four population
dynamics models
-
the "complete" model, eq. (11),
-
the "simplified" model, eq.(12),
-
the "adaptation" model, eq. (13).
Note: S is re-fitted (S = 0.9 h) to improve position of the "adaptation
model" surface N[C, t] relative to experimental data.
-
the "MIC model", eq. (4),
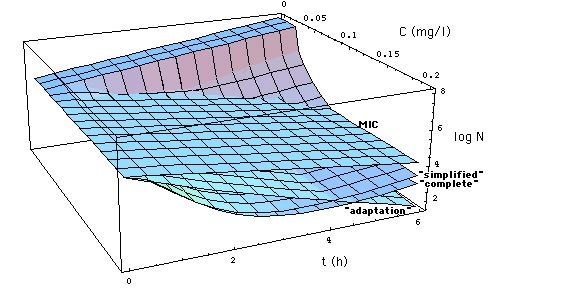
Fig. 4: Comparison of MIC
model (6, Fig. 1, MBC = MIC) with
Emax models (11, 12, 13).
Click on Figure to see comparison with MIC model in which MBC = 3 MIC.
The MIC model underestimates the
effect of the antibiotic except at concentrations near EC50
= 0.047 mg/l.
Fig. 5 shows experimental data presented
in the paper [Mattie
et al.] and sections through Fig. 4 at constant meropenem concentrations
C. The comparison with the "adaptation model" has been placed into a second
layer Fig. 5a.
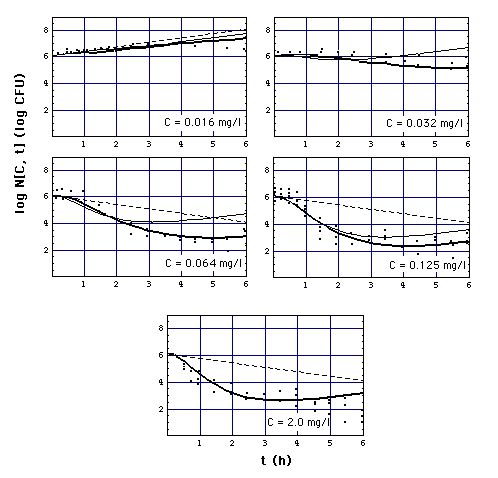
Fig. 5: Number N[C, t] of S.
aureus 1 organisms exposed to meropenem in vitro as a function of exposure
time t, calculated with
-
eq. (11) ("complete"
Emax model, heavy curves),
-
eq. (12) ("simplified"
Emax model, normal curves), click on figure to see "adaptation" model eq.
(13) instead of "simplified" model eq. (12).
-
eq. (6) (MIC model
with MIC = MBC = 0.03 mg/l, i.e. the surface N[C,t] in Fig. 1,
dashed curves).
-
Points are experimentally determined
numbers Nx[C,t] of S. aureus 1 (Fig.2 of [Mattie
et al]),
Meropenem concentrations C are 0.016,
0.032, 0.064, 0.128, 2.0 mg/l. Model (11) and
(12) curves coincide at C = 2.0 mg/l. MIC = 0.029 mg/l
is taken from Fig. 6, i.e. MIC is arbitrarily evaluated
at t = 1 h. If bacteria would be killed only when they cell divide, their
number would decrease as shown by lower dashed curve. Experimentally determined
numbers (coinciding more or less with heavy curves) show a faster decay
of population than that.
III. 5 Comparison Summary
-
The MIC model, eq. (6),
has no explanation for the observed more rapid decay of the bacteria population
at intermediate times:
-
In the MIC model the cell wall antibiotic
can at most kill all those cells that undergo cell division. So the rate
of growth R0 and
the maximum kill rate are conceptually bound to
be identical.
-
This is not how the "complete "model
interprets the experimental data: In the fitting process the minimum of
the R[C, t] curves at tmax (lower part of Fig. 2)
is not fixed to lie within the range 0 < R[C, t] < - R0.
The "complete" model represents the data best when (again see lower part
of Fig.
2)
-
the kill rate
exceeds the growth rate R0
initially, i.e.
R[C > EC50, t < tmax[C]]
< - R0 (except
for times near t = 0), and
-
then declines to a value within that
range at later times:
0 > R[C > EC50, t >> tmax[C]]
> - R0.
The microbiological process responsible
for the decline has not yet been fully understood. It is assumed that we
see a phenotypical selection during the exposure to the antibiotic [Mouton
et al.].
-
The simple Emax models, approximations
(12) and (13), might be called
"conservative" in the following sense: These models overestimate the number
of surviving bacteria by 2 orders of magnitude (or less), as one can see
in Figs. 4 and 5.
-
At large antibiotic concentrations (C
>> EC50) as well as at large exposure times t >> tmax,
the simplified Emax model eq. (12) differs only insignificantly
from the complete Emax model eq. (11).
-
The larger the antibiotic concentrations,
the less the complete Emax model and simplified
Emax model curves deviate from each other.
-
At large exposure times t >> tmax
and large antibiotic concentrations C >> EC50, the MIC model eq. (4)
deviates from the full Emax model by less than an order of magnitude (Fig.
5).
IV. REFERENCES
Burrascano
JJ, "Diagnostic hints and treatment guidelines for Lyme and other tick
borne diseases, 14. ed., 2002, COURSE
DURING THERAPY
Craig
WA, Pharmacokinetic/pharmacodynamic
parameters: rationale for antibacterial dosing of mice and men. Clin. Infect.
Dis., 1998, 26:1-10
Goodman
and Gilman's "The Pharmacological Basis of Therapeutics", Chapter.
43, "Pharmacokinetic Factors", search inside book for "1160", from results
select "on Page 1160".
Gruber
J,
Compartment models
displaying Lyme disease symptom cycles, 2002.
Gruber
J, Burrascano's Guidelines and Immune
Response Modeling, 2003.
Koop
AH, Neef C, van Gils SA.
A mathematical model for the efficacy and toxicity of aminoglycoside (April
2003). Workshop "Predictive Value of PK/PD models of antimicrobial
drugs". Leiden University Medical Center, Leiden, The Netherlands, 4 -
5. September 2003.
Mouton
JW, Vinks AA, Punt NC. Pharmacokinetic-Pharmacodynamic
Modeling of activity of ceftazidime during continuous and intermittent
infusion. Antimicrobial Agents and Chemotherapy 1997;1(4):733-738.
model 3 in Mouton
et al., page 734
Vinks
AA, Punt NC and Mouton JW.
Pharmacokinetic-Pharmacodynamic Modeling of Bacterial Growth and Killing
using the Modified Zhi Emax model. Workshop "Predictive Value of
PK/PD models of antimicrobial drugs". Leiden University Medical Center,
Leiden, The Netherlands, 4 - 5. September 2003.
Zhi J, Nightingale
CH, Quintiliani R. A
pharmacodynamic model for the activity of antibiotics against microorganisms
under nonsaturable conditions. J Pharm Sci 1986;75(11):1063-7.
Zhi JG, Nightingale CH, Quintiliani
R. Microbial
pharmacodynamics of piperacillin in neutropenic mice of systematic infection
due to Pseudomonas aeruginosa. J Pharmacokinet Biopharm 1988;16(4):355-75.
V. APPENDIX
V. 1 Dependence of MIC on Exposure Time
By definition, the Minimum Inhibitory
Concentration is the antibiotic concentration C = MIC at which the bacteria
population neither grows nor decreases, i.e. dN/dt = 0 in eq. (7).
This is the case when R[C, t] = 0.
Solving the "complete" model rate
expresssion eq. (8) for C, one can calculate the dependence
of MIC on the time the bacteria population has been exposed to the antibiotic.
Eq. (17) or (17m) can be solved for
MIC as a function of t. Mathematica can do this graphically. Fig. 6 is
Mathematica's plot of the function MIC[t].
Fig. 6: Dependence of MIC
on the time t during which the bacteria population has been exposed in
vitro to the antibiotic meropenem. The MIC's used in this paper are MIC[t
= 1 h] = 0.029 mg/l, e.g the MIC in Fig.1 and MIC[t
= 3 h] = 0.024 mg/l.
version August 8, 2012
URL
of this page
Home
of this server
Address comments to Joachim
Gruber